


Data preparation: definition, examples, advices
Data preparation: definition, examples, advices
To talk about data preparation, what better way to start than from observation. In the world of data, there is a rule that everyone knows: 80% of a data scientist’s time is spent preparing his data, and only 20% working on it, especially its visualization. This article will focus on data preparation: the most frequently encountered problems, tools, and trends. Let’s go for new data adventures!
Summary
- Introduction
- Data preparation: definition
- The 5 steps of data preparation
- Data preparation tools
- Recurring problems in data preparation
Introduction
It will not have escaped your notice that data is everywhere and is the driving force behind digital innovation. The multiplication of applications, the growing share of the Internet in our lives, the rise of the IoT (Internet of things) are all factors that explain why specific activities are developing around data. Therefore, new functions have appeared in IT departments: data engineer, data visualization specialist, and data scientist. Each of them is involved at different stages of the data enhancement process. But they all have a common need: the need for quality data. That’s what data preparation is all about.
3 tips for choosing a data preparation tool (ETL)
- Choose a tool with many input connectors
- It is crucial to have many features to transform data. ETLs often work with “boxes” to be connected. So make sure that the ETL you choose is complete in terms of these boxes.
- The joins are especially important. Choose a tool that has several types of joins. A join with fuzzy matching is often very useful and should be part of the features offered.
Data preparation : definition
The term “data preparation” refers to operations performed on raw data to make them analyzable.
Often tedious, data preparation involves importing the data, checking its consistency, correcting quality problems, and, if necessary, enriching it with other datasets.
Each step is essential and requires specific functionalities, especially at the time of data transformation.
Data preparation = the operations that are performed on raw data to make them analyzable
The 5 steps of data preparation
Let’s face it; there is no single “workflow,” and I don’t claim to present the absolute truth about data preparation. Based on my experience, I have tried to group recurring tasks into logical steps. Whether there are 5, 6, or 7 is of little importance in the end. What matters is that you understand the content of each operation.

Importing or acquiring data
The first step is to “acquire” the data needed for the job. These data can come from different places, have other formats. Therefore, it is essential to choose a tool that has multiple connectors so as not to get stuck. If flat files are one of the most common formats, we should certainly not neglect more exotic formats. In this example of data preparation from files extracted from LinkedIn, flat files (in CSV format) had to be prepared alongside .har and JSON files. When it comes to data import, you have to be ready for all eventualities!

Discovery
The 2nd stage is quite exciting. It’s about discovering the data, exploring it. At this stage, the goal is not to analyze the correlations but rather to look for errors that could have crept in here and there. It is essential to identify the empty fields, the data formats. A quick visualization is useful for this purpose because it will allow you to see right away if the data format is the right one (try to make a graph if your data is stored in text). When I use Anatella, I appreciate being able to have descriptive statistics of the data in 1 click. This allows me to immediately identify erroneous categories, outliers, and especially “Null” values. Take advantage of the data discovery step to perform a few simple tests to detect less obvious problems that need to be corrected in the next stage. For example, use sorting functions to detect duplicates.

Data cleaning
In the 3rd step of data preparation (also called “data prep” to sound professional), the data must be organized and cleaned. At this stage, I like to reorganize already and rename the columns and eliminate the redundant ones when it is the case. This allows you to have the premises of a data model and your UML diagram’s first stone. Then comes the time to go into more detail. During the discovery stage, you have already been able to correct the most obvious format problems. Now it’s time to bring out the less obvious issues. I’m thinking here, for example, of the difficulties of duplicates (deduplication), data separation. Data cleansing can also include a “transformation” part. For instance, you could detect a category of data that needs to be modified to be usable. In case your dataset contains outliers, transformation operations are useful to exploit your valuable data still.

Enhancement
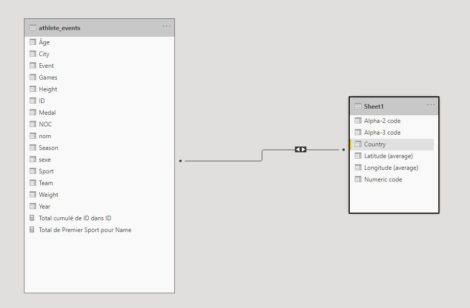
Data enhancement (increasingly called “data wrangling” or “data munging”) consists of “augmenting” your dataset with external data. To do this, you will need to create a join. There are different types of joins. What I like with a solution like Anatella is the possibility to choose between different types of joins. One of them is incredibly unique because it is a fuzzy matching type of join. This feature is so unique that I even did an article comparing Anatella, Alteryx, and Tableau Prep’s processes. You can do simple joins (when all the data has been cleaned) directly in your data visualization solution (see our DataViz guide here). There are advantages and disadvantages to such a practice. I prefer to prepare my data in one single software package, and once the process is finished, start the analysis work.

Publication
Once everything is well organized, cleaned up, and enhanced, all that’s left to do is publish the final dataset. Most of the time, the data will be “pushed” to the Cloud or exported. Depending on how you will use the data after data preparation, it may be useful to opt for export in an optimized data format. For example, if you work like me with Tableau, it is recommended to export the files in .hyper format. The ETL I use (Anatella) was the first to my knowledge to have output in this format.
Data preparation: the tools
While some hardcore developers still prefer to do everything by hand with code lines, I have long since opted for “no-code” solutions that work much more efficiently. I work with Tableau Prep, Alteryx, and Anatella. But some people swear by Talend, Azure Data Factory, Informatica Power Center. As you can see, the tools are legion, and that may be the problem. There are so many that the choice becomes difficult.
If you are looking for a free solution, I advise you to use Anatella, marketed by Timi. I am a fan, and I even teach my 11-year-old son to use it. He makes some demos in videos on various data problems (data separation, deduplication).A workflow implemented using Anatella for data wrangling using an NLP (Natural Language Processing) algorithm.
For some specific points of data preparation, alternative solutions exist. For example, a join can be performed in an ETL or directly in most data visualization solutions. The choice is yours. Refer to the table below to see the disadvantages of both approaches.
What is ETL (Extract – Transform – Load)?
ETL software, or Extract-Transform-Load, is used to manage all aspects of data preparation:
- Extract: extract data from a file, whatever its format.
- Transform: cleanse and transform data to make it usable.
- Load: Export data and load it into an environment where it becomes available for the next valuation stage.
Data preparation: frequent problems
Below, I have tried to list some of the most common data preparation problems you may encounter.
Source: IntoTheMind

